Mark price vs last price vs index price: which one liquidates you?
Perpetual futures show three prices that are easy to mix up. The last price is where the most recent trade happened. The index price is an average of spot prices across several exchanges. The mark price is an exchange's estimate of what the contract is fairly worth, and on the major exchanges it is what decides your unrealised profit and whether you are liquidated. Knowing which price does what explains why a position can be liquidated even though the chart never touched your liquidation level.
Your trades fill at the last traded prices, but liquidation is normally triggered by the mark price. The mark price leans on the index so that one wild trade on one exchange cannot wipe out positions, which means it can differ from the price you see on the chart.
The three prices at a glance
- Last price: the price of the most recent trade on this contract on this exchange. It is what most charts show by default, and it is what your order actually fills against.
- Index price: a weighted average of the underlying asset's spot price across several exchanges. It represents the wider market and not this one contract.
- Mark price: a calculated fair value, built from the index and other inputs, that the exchange uses for risk. It moves more smoothly than the last price.
In a calm market all three sit within a few basis points of each other, and you can ignore the difference. In a violent market they separate, and that is exactly when the difference matters most.
Why exchanges do not liquidate on the last price
A contract's last price can be pushed around. A single large market order in a thin order book can print a trade far from where the asset is really worth. If liquidations triggered on that price, one large order could set off a chain of forced closes, each pushing the price further, and the result would be a cascade that had little to do with the value of the asset.
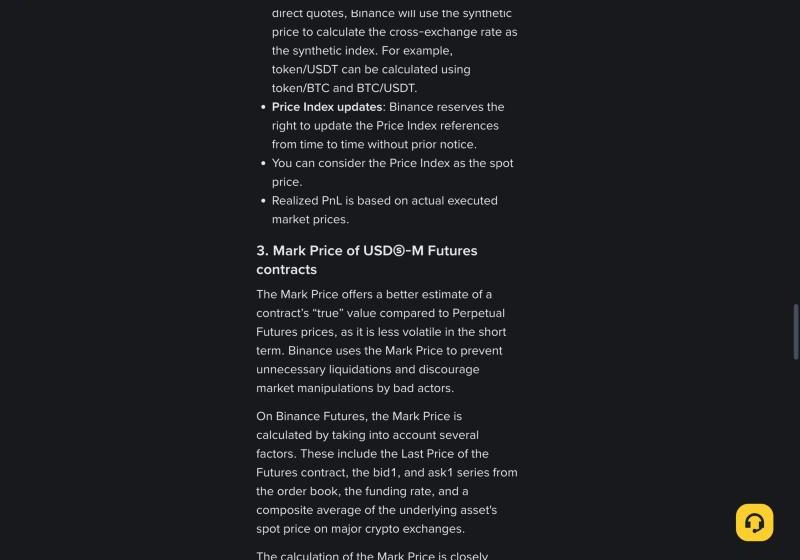
Using a mark price defends against that. Binance describes its mark price as a way to prevent unnecessary liquidations and discourage manipulation, and says it is less volatile in the short term than the perpetual's own price. On Binance, the inputs include the contract's last price, the best bid and ask series from the order book, the funding rate, and a composite average of spot prices on major exchanges.
How the index price is protected
Because the mark price leans on the index, the index needs protecting as well. Binance's published method is a good illustration of the defences involved. Its USD-margined index draws on a broad list of exchanges, and it applies rules to single sources that go astray. For example, if one exchange's price deviates more than 3% from the median of all sources, Binance caps that source at 1.03 or 0.97 times the median.
That rule is why one exchange showing a sudden wick does not automatically move the index on another. It also explains something traders sometimes find confusing: a spot wick on one exchange may be absent from the mark price elsewhere, and a chart built from one exchange's trades cannot tell you what the index did. When a data source fails or a token has no good direct quote, exchanges also fall back on synthetic prices or other protective mechanisms, and these are documented in their help pages.
Why you can be liquidated when the chart never touched your price
This is the complaint that sends most traders looking for this explanation. Suppose you hold a long with a liquidation price of 60,000. Your chart shows the last price with a low of 60,150. Yet you were liquidated. Usually one of these happened:
- The mark price went lower than the last price. During a fast fall, the index can drop faster than a contract's own trades, or the mark calculation can move ahead of the chart you are viewing.
- The liquidation price moved. It is not fixed. In cross margin, losses on other positions change it, and funding payments slowly reduce your margin. The level you noted an hour ago may have changed.
- Your chart is using the wrong source. Many platforms let you switch the chart between last price and mark price. Look at the mark price chart for the time of the event before drawing a conclusion.
The reverse happens too. A sudden wick on the last price can pass straight through your liquidation level without triggering it, because the mark price did not follow. That protection is the purpose of the design, and it is why a long wick on a chart often does not produce the wave of liquidations you might expect.
Which price is used for what
The exact rules vary between exchanges and contracts, so treat this as a general map and confirm against your exchange's documentation.
- Order fills: always real trades, so the last traded prices and the order book.
- Realised profit and loss: based on your actual fills. Binance states this directly for its USD-margined contracts.
- Unrealised profit and loss: commonly based on the mark price, though some platforms let you display it using last price.
- Liquidation: normally based on the mark price.
- Funding payment: usually position value at the mark price at settlement, multiplied by the rate. So mark price also decides the size of your funding.
- Premium index: compares prices at which an order could be filled against the index, and that premium feeds the funding rate.
Stop orders: choosing a trigger price
Many exchanges let you set a stop order to trigger on either the last price or the mark price. Neither choice is always correct.
- A last-price trigger responds to real trades on this contract. It reacts fast, but a brief wick can fire it, and then you are out of the position at a poor price while the market recovers.
- A mark-price trigger ignores most wicks and is less likely to fire on noise. But in a truly rapid move it can react later, and when it does fire, your order still fills at real traded prices, which may be far away.
Whichever you use, a stop is not a guaranteed price. A stop-market order fills at whatever the book offers, and our guides on order book depth and market order costs explain how far that can be from the trigger.
A worked example of a price gap
Take a long of 0.5 BTC at an entry price of 70,000 with 7,000 USDT of isolated margin. Assume the maintenance margin is small for simplicity. Then the liquidation price is near 56,000, since a 14,000 USDT fall per BTC on 0.5 BTC consumes the 7,000 USDT. Now imagine a crash during which, for one minute, the contract trades 200 points above the index because forced buying from shorts is hitting a thin book. The last price shows 56,150 while the mark price, following the index, reaches 56,000. The chart you are watching never touches your level, yet you are liquidated.
The numbers are illustrative. Real liquidation prices also depend on maintenance margin tiers, fees and your margin mode, and most exchanges display a precise figure on the position screen. Trust that figure over your own quick arithmetic, and remember that it changes.
What to watch in practice
- Keep a buffer from liquidation. The gap between mark and last price is usually small, but it grows at precisely the moments when you are most likely to be close to your level.
- View the mark price chart. Most trading screens offer it as an alternative chart type. Check it after any surprising event.
- Watch the gap as a warning. A wide difference between last and index means the contract has separated from the market. It affects the premium, and the funding rate tends to follow. See our guide to what a funding rate is.
- Read your exchange's page. Definitions and index components change. Binance states that it can update its index references without prior notice.
Common questions about mark price
Why is the mark price different on each exchange?
Each exchange chooses its own index sources, weights and formula, and includes its own contract's prices in the calculation. They normally sit very close to each other because they all track the same asset, but they are not the same number and should not be expected to match exactly.
Can I place an order at the mark price?
No. The mark price is a reference and not a market. You can only trade at prices others are willing to fill at, which means the order book. You may be able to use the mark price as a trigger for a conditional order, but the resulting fill is still at traded prices.
Does the mark price make liquidation fair?
It reduces one specific unfairness, namely being liquidated by a single bad trade. It does not protect you from a real market move. If the wider market falls through your level, you will be liquidated, and high leverage leaves a narrower margin for error whatever price is being used.
Check these on any new contract
- Find which price triggers liquidation on this exchange.
- Open the mark price chart alongside the last price chart.
- Note your liquidation price and how far away it is in percent.
- Choose your stop trigger deliberately and test a small order.
- Read the index components for the exact contract.
Related reading: What a funding rate is · How to estimate slippage from order book depth · What to do when an exchange goes down
Sources
Binance · Mark price and price index · How we measure · About Tickmark
Other guides
What is a funding rate in crypto perpetual futures? A plain explanation
A funding rate is a regular payment between traders holding opposite sides of a perpetual futures contract. It exists because a perpetual contract never expires, so something else has to keep its price close to the underlying asset. When the rate is positive, longs pay shorts; when it is negative, shorts pay longs. The exchange sets the formula but, on the major exchanges, the money moves between traders.
How to compare funding rates across crypto exchanges: 8h vs 4h settlement
You cannot compare two funding rates by looking at the percentages alone. A rate only means something once you know how often it is charged, whether you are long or short, and whether the two readings describe the same contract at the same moment. The same +0.01% costs twice as much per day on a four-hour schedule as on an eight-hour one, and it earns a short exactly what it costs a long.
What does a negative funding rate mean? Who pays, and what it does not tell you
A negative funding rate means traders holding short positions pay traders holding long positions at the next settlement. It usually happens when a perpetual contract trades below its index price, which often reflects heavy shorting or hedging. It does not mean the price is about to fall or about to rise, and it is not free income for longs, because the price can move against them by far more than the payment.
How to convert a funding rate to APR, and why the number can mislead you
To annualise a funding rate, multiply the rate per settlement by the number of settlements in a day, then by 365. A rate of 0.01% every eight hours becomes 0.01% × 3 × 365 = 10.95% a year. This puts contracts on different schedules onto one scale, which makes them comparable. It does not tell you what you will earn or pay over a year, because it assumes today's rate never changes.
Funding rate arbitrage explained: how it works and what eats the profit
Funding rate arbitrage means holding two offsetting positions in the same asset so that price moves roughly cancel, and collecting funding payments on one side. The classic version buys spot and shorts the perpetual. A second version shorts the perpetual on the exchange with the higher rate and goes long on the exchange with the lower rate. It is often described as risk free. It is not. The risks are simply different from the risk of an ordinary directional trade.
How much does a market order really cost? Fees, spread and slippage
The fee on an exchange's fee page is only part of what a market order costs. The rest comes from the price you actually receive, which depends on the direction of your trade, your order size and the depth of the order book at that moment. To compare exchanges fairly, measure the average fill price against one reference price, then add your trading fee on top, and be careful not to count the spread twice.
How to estimate slippage from order book depth before you trade
Slippage is the difference between the price you expected and the average price you actually got. You can estimate most of it before placing an order, because the order book shows how much is available at each price. Add up the levels on the side you will consume until they cover your size, calculate the average price, and compare it with the mid price. The estimate is only as good as the snapshot it came from, and books thin out at the moments you are most likely to need them.
Maker and taker fees explained: how to compare crypto exchange trading fees
A maker adds an order to the book that waits to be filled. A taker fills against an order already there. Most exchanges charge takers more than makers, because makers supply the liquidity others trade against. Comparing exchanges by the headline fee alone is misleading: you need to know which side you usually trade on, what tier your volume actually puts you in, and how the fee compares with slippage and funding on the same trade.
How to check if a crypto exchange is down: a step-by-step guide
When an exchange stops working for you, the first question is whether it is down for everyone or only for you. You can usually answer that in a couple of minutes: check the exchange's own status page, check an independent measurement, try a different network, and test the public API directly. Each source sees something different, so one green page does not prove everything is fine, and one failed request does not prove the exchange is down.
Is an exchange really down? How to read API uptime and outage records
Uptime describes the share of successful requests to particular services, over a particular period, from a particular network route. It does not establish whether you can place an order, withdraw funds or trust an exchange with your assets. A figure like 99.9% is useful only if you know what was tested, from where and for how long, so this guide explains how to read those details on our pages and on anyone else's.
What to do when a crypto exchange goes down while you have an open position
If an exchange stops responding while you hold a position, your first job is to find out what is actually broken, the second is to stop making it worse, and the third is to reduce your risk by whatever route still works. Do not keep resending the same order, because earlier attempts may have gone through. Check the mobile app and the API as alternative routes, consider hedging elsewhere if your exposure is large, and record what happened in case you need to raise it later.
Why exchange APIs reject timestamps: clock offset and stale quotes explained
A fast response can contain an old quote. Round-trip latency, clock offset and quote age describe different parts of a request, and mixing them up can make a clock mismatch look like a delayed market feed. This guide explains each one with a worked example, shows how we estimate them, and covers what to do when an exchange API rejects your request because of the time.
Binance error -1021 timestamp: causes and how to fix it
Binance API error -1021 INVALID_TIMESTAMP means the timestamp on your signed request falls outside the window Binance will accept. The message usually reads "Timestamp for this request is outside of the recvWindow" or "was 1000ms ahead of the server's time". In most cases your own clock is the cause, so the fix is to synchronise it, measure the offset against Binance's server time, and handle any remaining network delay properly. A larger recvWindow can hide the problem, but it should not be your first move.
Crypto exchange API rate limits: what error 429 means and how to stay under it
HTTP 429 means you have sent too many requests in a given time, and the server is asking you to slow down. It is not an outage. Each exchange counts requests differently: Binance uses a weight for each endpoint and bans IP addresses that keep going after a 429, Bybit blocks an IP that passes 600 requests in five seconds, and OKX sets limits per endpoint and returns error code 50011. Staying under the limit means reading the response headers, backing off properly and using WebSockets where you can.
Why an exchange API returns 403 or 451: blocks and regions
A 403 means the server understood your request and refuses to carry it out. A 451 means access is refused for legal reasons. On crypto exchange APIs, a 403 can be a web firewall, a request limit, an unauthorised key or a regional block, so the code alone does not tell you which. The response body, the exchange's documentation and a comparison from another network usually do. A real restriction applies to you for a reason, so the right response is to find out whether the service is available where you are.
Before you open a crypto exchange account: a checklist by country
Before you open an account on a crypto exchange, check four things: whether the exchange is allowed to serve people where you live, whether your country's regulator lists it, whether the site in front of you is the real one, and how the exchange has been running lately. The sign-up form takes ten minutes. Recovering from the wrong choice can take months, and sometimes it is not possible at all. This guide works through each check, using Binance and OKX as worked examples because they are the two exchanges readers ask us about most.
How to open and verify a Binance account: a step-by-step guide
Opening a Binance account takes four steps: register with an email address, a phone number or a Google, Apple or Telegram account; complete identity verification; secure the account; and make a first deposit. Registration takes a few minutes. Binance says verification is usually reviewed within 48 hours. This guide follows each step as Binance's own help pages describe it on 8 November 2026, with screenshots of those pages, and points out the details that most often cause trouble later.
How to open and verify an OKX account: a step-by-step guide
Opening an OKX account takes four steps: register with your country of residence, an email address and a phone number; complete identity verification; secure the account; and make a first deposit. OKX says it reviews verification applications within 24 hours. Which OKX company you end up with depends on where you live, and that decides the address you log in at, the fees you pay and the products you see. This guide follows OKX's own help pages as they stood on 8 November 2026, with screenshots, and flags the choices that are hard to undo. OKX shows some help pages differently by region; we read the versions served at okx.com/en-us, and the rules shown in your own account after you log in are the ones that apply to you.